Monday, April 25, 2016

Common problem for a DBA - Parameter Sniffing

As a DBA, one common problem I often see at our customers is something call parameter sniffing. Queries or “applications” suddenly start to run very slow. Since the user experience slowness, they of course ask the DBA what is wrong. As I see, it is maybe not the DBA´s role to solve it, but we must be aware about it, and come up with advice how to handle it. So in that way it´s on our table anyway. In this article I will explain basic parameter sniffing, how you can find it and the possible workarounds.


Explanation

From my experience the problem often occurs on SQL statements where there is a column in the WHERE clause with very different amounts of data. Below is an example of a simple table call dbo.customer. We have a big difference in the amount of records between the cities values.


City                     Count
Halmstad          1000000
Kiruna                1
London              100

Paris                   10

To get the data the SQL engine chooses a different approach, if it is a low selectivity or a high one. The city named Kiruna, use a Key Lookup, but for Halmstad a Clustered Index Scan is the best choice.

SELECT * FROM dbo.customer WHERE City = 'Kiruna'
SELECT * FROM dbo.customer WHERE City = 'Halmstad'
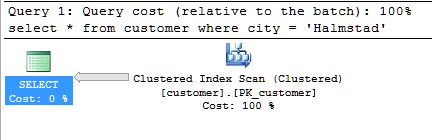


If we create a stored procedure for this SELECT statement instead, we will probably see issues with parameter sniffing.

CREATE PROCEDURE USP_GetCustomerByCity @City VARCHAR(50)
AS
SELECT * FROM dbo.customer WHERE City = @City

If we now run this stored procedure with the high selectivity value for city Kiruna it will be compiled with this particular SELECT statements query plan, which use a Key Lookup. Then if we change and run the procedure with the low selectivity value for the City Halmstad it still compile with the first value. This even if a Clustered Index Scan would perform better. You can also see that SQL assume it is one row with this value, see “Estimated Number of Rows”.


If the SQL had run a Clustered Index Scan instead of a Key Lookup, which it should have done with correct compilation, we should have seen a dramatic difference in the reads, as you can see from the output from Statistics IO. First with a Clustered Index Scan and second with a Key Lookup.

Table 'customer'. Scan count 1, logical reads 7316
Table 'customer'. Scan count 1, logical reads 3002730

Find the problematic stored procedures

So how is it possible to troubleshoot this and find the stored procedures who perform badly? Unfortunately, there is no place just to check this in an easy way in SQL.
In one approach to try finding out which procedure suffers or should possible suffer from parameter sniffing; we are interested in queries with big difference in the logical reads. In the DMV sys.dm_exec_query_stats SQL collects information about queries. This DMV has the information from all the queries in the cache. How many times they have executed, amount of rows returned and so on. In this case, we can get use of the MIN and MAX logical reads done for our query. Let us run the statement below.


SELECT qs.execution_count,
    SUBSTRING(qt.text,qs.statement_start_offset/2 +1,
                 (CASE WHEN qs.statement_end_offset = -1
                       THEN LEN(CONVERT(nvarchar(max), qt.text)) * 2
                       ELSE qs.statement_end_offset end -
                            qs.statement_start_offset
                 )/2
             ) AS query_text,
             qs.last_logical_reads,
             qs.max_logical_reads,
             qs.min_logical_reads,
             qs.total_logical_reads
FROM sys.dm_exec_query_stats AS qs
CROSS APPLY sys.dm_exec_sql_text(qs.sql_handle) AS qt
WHERE qt.text like '%USP_GetCustomerByCity%'
ORDER BY qs.execution_count DESC;


This returns the information about this examples particular procedure, and it says it has been executed seven times, and the Max_logical_read is 3002734 compared to the Min_logical_read that is 6. It is quite a big difference, and it reflects the information I received by Statistics IO quite good, when I did run the SELECT statements outside the procedure in the first run.

Therefore, from this perspective we maybe can conclude that this statement suffers from parameter sniffing problem. It is not a guarantee but a good way to start, if you have no knowledge about the procedures in your system.


Workarounds


One way to solve the problem, as I have find myself doing often, is to run EXEC SP_UPDATESTATS. Probably not the best way to solve it, but it often works since it also triggers a recompile of stored procedures. Often you are in hurry and not sure if maybe the statistics is bad, which is a common problem as well. However, a correct solution would of course be to code the procedure correctly instead. There are a few ways to do it, as described in short here.

RECOMPILE
Create the procedure with the option “WITH RECOMPILE”

CREATE PROCEDURE [dbo].[USP_GetCustomerByCity] @City VARCHAR(50)
WITH RECOMPILE
AS
SELECT * FROM dbo.customer WHERE City = @City;

OPTIMIZE FOR
Create the procedure with the option “OPTIMIZE FOR” as the example below. I think this is the best approach in newer versions of SQL.

CREATE PROCEDURE [dbo].[USP_GetCustomerByCity] @City VARCHAR(50)
AS
SELECT * FROM dbo.customer WHERE City = @City
OPTION (OPTIMIZE FOR (@City = 'Halmstad'))

Plan Guide
This option can be useful when you can´t change the procedure. By create a Plan Guide for the procedure you can set the options there instead of changing the procedure.

Local variable
If the parameter values are known while compiling the stored procedure, the optimizer uses the statistics histogram and generate the best plan for the parameters. When we define local variables and use that in the query, the SQL server will not be able use the parameter values to find the optimal value. In this scenario, the optimizer uses density vector information of the statistics, and it will generate the same execution plan for all input parameters.

CREATE PROCEDURE [dbo].[USP_GetCustomerByCity] @City VARCHAR(50)
AS
DECLARE @LocalVariable VARCHAR(50) = @City
SELECT * FROM dbo.customer WHERE City = @LocalVariable

Conclusion

Even if this is a quite common problem, I see that many developers are not aware about this and how SQL works. To find the problem procedures you have to dig into the plan_cache, and it is quite difficult to find the problem. I think and hope the query_store in SQL 2016 can be useful to trouble shoot this kind of problem. I will try it out when it is more available. 

Tuesday, August 4, 2015

Partitioning and simple partitioning switching

Partitioning in SQL server
In this article I would present some good SQL featuers. I got a question from a customer how they can insert data on daily basis into a table which is used quite much so the focus was to minimize the impact for the insert operation. One way to solve this issue can be to make use of the partitioning in SQL and the Partitioning switching. We use one table for staging where we load the data at any time. Then since the switching operation just take some milliseconds we can do it at any time.

CREATE TABLE [dbo].[tblTestPartition](
            [id] [int] NOT NULL,
            [datum] [datetime] NULL,
            [objekt] [varchar](50) NULL
)
GO
CREATE TABLE [dbo].[tblTestPartitionStaging](
            [id] [int] NOT NULL,
            [datum] [datetime] NULL,
            [objekt] [varchar](50) NULL
)
GO
-----------Create the filegroups------------------------
ALTER DATABASE [testDB] ADD FILEGROUP [FGTestPartition1]
GO
ALTER DATABASE [testDB] ADD FILEGROUP [FGTestPartition2]
GO
ALTER DATABASE [testDB] ADD FILEGROUP [FGTestPartition3]
GO
ALTER DATABASE [testDB] ADD FILEGROUP [FGTestPartition4]
GO
------Setup the files, one on each filegroup-----------
ALTER DATABASE [testDB] ADD FILE ( NAME = N'FileTestPartition1',
FILENAME = N'C:\Program Files\Microsoft SQL Server\MSSQL11.MSSQLSERVER\MSSQL\DATA\TestPartition1.ndf' ,
SIZE = 5120KB , FILEGROWTH = 1024KB ) TO FILEGROUP [FGTestPartition1]
GO
ALTER DATABASE [testDB] ADD FILE ( NAME = N'FileTestPartition2',
FILENAME = N'C:\Program Files\Microsoft SQL Server\MSSQL11.MSSQLSERVER\MSSQL\DATA\TestPartition2.ndf' ,
SIZE = 5120KB , FILEGROWTH = 1024KB ) TO FILEGROUP [FGTestPartition2]
GO
ALTER DATABASE [testDB] ADD FILE ( NAME = N'FileTestPartition3',
FILENAME = N'C:\Program Files\Microsoft SQL Server\MSSQL11.MSSQLSERVER\MSSQL\DATA\TestPartition3.ndf' ,
SIZE = 5120KB , FILEGROWTH = 1024KB ) TO FILEGROUP [FGTestPartition3]
GO
ALTER DATABASE [testDB] ADD FILE ( NAME = N'FileTestPartition4',
FILENAME = N'C:\Program Files\Microsoft SQL Server\MSSQL11.MSSQLSERVER\MSSQL\DATA\TestPartition4.ndf' ,
SIZE = 5120KB , FILEGROWTH = 1024KB ) TO FILEGROUP [FGTestPartition4]
GO
---------Create the Partition functions-----------------
CREATE PARTITION FUNCTION [TestPartitionRange](datetime) AS RANGE RIGHT FOR VALUES ('2015-01-01', '2014-01-01', '2013-01-01');
GO
CREATE PARTITION FUNCTION [TestPartitionRangeStaging](datetime) AS RANGE RIGHT FOR VALUES ('2015-01-01', '2014-01-01', '2013-01-01');
GO
--------Create the Partition scheme----------------------
CREATE PARTITION SCHEME [TestPartitionRangeScheme]
AS
PARTITION TestPartitionRange
TO ([FGTestPartition1], [FGTestPartition2], [FGTestPartition3], [FGTestPartition4], [Primary]);
GO
CREATE PARTITION SCHEME [TestPartitionRangeSchemeStaging]
AS
PARTITION TestPartitionRangeStaging
TO ([FGTestPartition1], [FGTestPartition2], [FGTestPartition3], [FGTestPartition4], [Primary]);
GO
------Create the clustred index to the partitions--------
CREATE CLUSTERED INDEX [CLIX_Datum] ON [dbo].[tblTestPartition]
(
            [datum] ASC
)WITH (PAD_INDEX = OFF, STATISTICS_NORECOMPUTE = OFF, SORT_IN_TEMPDB = OFF, DROP_EXISTING = OFF, ONLINE = OFF,
ALLOW_ROW_LOCKS = ON, ALLOW_PAGE_LOCKS = ON)
ON TestPartitionRangeScheme (datum)
GO
CREATE CLUSTERED INDEX [CLIX_Datum] ON [dbo].[tblTestPartitionStaging]
(
            [datum] ASC
)WITH (PAD_INDEX = OFF, STATISTICS_NORECOMPUTE = OFF, SORT_IN_TEMPDB = OFF, DROP_EXISTING = OFF, ONLINE = OFF,
ALLOW_ROW_LOCKS = ON, ALLOW_PAGE_LOCKS = ON)
ON TestPartitionRangeSchemeStaging (datum)
GO

With the tables and partitioning objects in place we can now add some test data.
INSERT INTO [dbo].[tblTestPartition] ([id],[datum],[objekt]) VALUES (1, '2015-01-31', 'Test'); --Partition 4
INSERT INTO [dbo].[tblTestPartition] ([id],[datum],[objekt]) VALUES (1, '2014-01-31', 'Test'); --Partition 3
INSERT INTO [dbo].[tblTestPartition] ([id],[datum],[objekt]) VALUES (1, '2013-01-31', 'Test'); --Partition 2
INSERT INTO [dbo].[tblTestPartition] ([id],[datum],[objekt]) VALUES (1, '2012-01-31', 'Test'); --Partition 1
INSERT INTO [dbo].[tblTestPartition] ([id],[datum],[objekt]) VALUES (1, '2011-01-31', 'Test'); --Partition 1

Notice that I did add data also to the partition holding the most accurate data. So if we try to do the switching now it will fail with the error:

Msg 4904, Level 16, State 1, Line 106
ALTER TABLE SWITCH statement failed. The specified partition 4 of target table 'testDB.dbo.tblTestPartition' must be empty.


So let’s remove that record, 
delete from tblTestPartition where datum = '2015-01-31 00:00:00.000'

If we do a select against the destination table we see those 4 records now.


And the data in the staging table has one row.


Now it’s time to do the magic things. We will now move the data from tblTestPartitionStaging in partition 4 to the corresponding partition in the destination table tblTestPartition. We use ALTER TABLE command.

ALTER TABLE tblTestPartitionStaging SWITCH PARTITION 4 TO tblTestPartition PARTITION 4

Now the destination table has those record below and the staging table has zero records.


Friday, May 29, 2015

Get all the database and their size from a server


SELECT    DB_NAME(db.database_id) as DatabaseName,
    CAST((CAST(mfrows.RowSize as decimal(18,2)) * 8) /POWER(1024,2) AS DECIMAL(18,2)) as DataFileSizeGB,
    CAST((CAST(mfrows.RowSize as decimal(18,2)) * 8) /POWER(1024,1) AS DECIMAL(18,2)) as DataFileSizeMB,
    CAST((CAST(mflog.LogSize as decimal(18,2)) * 8) /POWER(1024,2) AS DECIMAL(18,2)) as LogFileSizeGB,
    CAST((CAST(mflog.LogSize as decimal(18,2)) * 8) /POWER(1024,1) AS DECIMAL(18,2)) as LogFileSizeMB
FROM sys.databases db
    LEFT JOIN (
SELECT database_id, SUM(size) RowSize FROM sys.master_files WHERE type = 0 GROUP BY database_id, type
  ) mfrows
  ON mfrows.database_id = db.database_id
    LEFT JOIN (
SELECT database_id, SUM(size) LogSize FROM sys.master_files WHERE type = 1 GROUP BY database_id, type
 ) mflog
 ON mflog.database_id = db.database_id
ORDER BY DB_NAME(db.database_id)

Friday, January 9, 2015

Filestats IO assessment


In this post I will show how to use sys.dm_io_virtual_file_stats to collect I/O statistics over a sertain time. There are many good information written about this DMV but I have not seen any easy one about how to collect and analyse data from the DMV over time.

I will show one way I often use. The post is written with inspiration from Paul Randals excelent article. but I have done some change to fit my needs.


First creat a table to logg the information.


CREATE TABLE [dbo].[FileStatsIO](
[database_id] [smallint] NOT NULL,
[file_id] [smallint] NOT NULL,
[num_of_reads] [bigint] NOT NULL,
[io_stall_read_ms] [bigint] NOT NULL,
[num_of_writes] [bigint] NOT NULL,
[io_stall_write_ms] [bigint] NOT NULL,
[io_stall] [bigint] NOT NULL,
[num_of_bytes_read] [bigint] NOT NULL,
[num_of_bytes_written] [bigint] NOT NULL,
[file_handle] [varbinary](8) NOT NULL,
[timestamp] [datetime] NULL
) ON [PRIMARY]


Then creat a job which run once every hour. If you want you can of course change the time to suit the timeframe you like to have.

INSERT INTO [dbo].[FileStatsIO]
([database_id]
,[file_id]
,[num_of_reads]
,[io_stall_read_ms]
,[num_of_writes]
,[io_stall_write_ms]
,[io_stall]
,[num_of_bytes_read]
,[num_of_bytes_written]
,[file_handle]
,[Timestamp])
SELECT [database_id], [file_id], [num_of_reads], [io_stall_read_ms],
[num_of_writes], [io_stall_write_ms], [io_stall],
[num_of_bytes_read], [num_of_bytes_written], [file_handle], GETDATE()
FROM sys.dm_io_virtual_file_stats (NULL, NULL);


When you have some data we come to the intressting part. Lets analyse it.

;WITH CTE1 AS
(
SELECT 
a.[timestamp],a.[database_id], a.[file_id], a.[file_handle],
rank()  OVER (PARTITION BY [database_id], [file_id] ORDER BY  [timestamp] ASC) AS Rnk,
a.[num_of_reads] AS [a_num_of_reads],
CASE WHEN [num_of_reads] = 0 THEN 0 
ELSE LAG(num_of_reads, 1) OVER(PARTITION BY [database_id], [file_id]  ORDER BY  [timestamp] ASC) 
END AS [b_num_of_reads],
a.[num_of_bytes_read] AS [a_num_of_bytes_read],
CASE WHEN num_of_bytes_read = 0 THEN 0 
ELSE LAG(num_of_bytes_read, 1) OVER(PARTITION BY [database_id], [file_id]  ORDER BY  [timestamp] ASC) 
END AS [b_num_of_bytes_read],
a.[io_stall_read_ms] AS [a_io_stall_read_ms],
CASE WHEN [io_stall_read_ms] = 0 THEN 0 
ELSE LAG(io_stall_read_ms, 1) OVER(PARTITION BY [database_id], [file_id]  ORDER BY  [timestamp] ASC) 
END AS [b_io_stall_read_ms],
a.[num_of_writes] AS [a_num_of_writes],
CASE WHEN num_of_writes = 0 THEN 0 
ELSE LAG(num_of_writes, 1) OVER(PARTITION BY [database_id], [file_id]  ORDER BY  [timestamp] ASC) 
END AS [b_num_of_writes],
a.[io_stall_write_ms] AS [a_io_stall_write_ms],
CASE WHEN io_stall_write_ms = 0 THEN 0 
ELSE LAG(io_stall_write_ms, 1) OVER(PARTITION BY [database_id], [file_id]  ORDER BY  [timestamp] ASC) 
END AS [b_io_stall_write_ms],
a.[io_stall] AS [a_io_stall],
CASE WHEN io_stall = 0
THEN 0 ELSE LAG(io_stall, 1) OVER(PARTITION BY [database_id], [file_id] ORDER BY  [timestamp] ASC) 
END AS [b_io_stall],
a.[num_of_bytes_written] AS [a_num_of_bytes_written],
CASE WHEN num_of_bytes_written = 0 THEN 0 
ELSE LAG(num_of_bytes_written, 1) OVER(PARTITION BY [database_id], [file_id] ORDER BY  [timestamp] ASC) 
END AS [b_num_of_bytes_written]
FROM FileStatsIO a
--SET FILTER HERER  IF YOU WANT--
where a.database_id = 7
)
SELECT database_id, file_id, [timestamp],
--Read stats--
(a_num_of_reads - b_num_of_reads) as reads,
[TotalByteRead] = ((ISNULL(a_num_of_bytes_read,0) - ISNULL(b_num_of_bytes_read,0))),
[AvgBytePerRead] = ((ISNULL(a_num_of_bytes_read,0) - ISNULL(b_num_of_bytes_read,0))) /
(CASE WHEN ISNULL((a_num_of_reads - b_num_of_reads),1) = 0 THEN 1 
ELSE ISNULL((a_num_of_reads - b_num_of_reads),1) END),
a_io_stall_read_ms,
b_io_stall_read_ms,
[ReadLatency(ms)] =
(ISNULL(a_io_stall_read_ms,0) - ISNULL(b_io_stall_read_ms,0)) /
(CASE WHEN ISNULL((a_num_of_reads - b_num_of_reads),1) = 0
THEN 1 ELSE ISNULL((a_num_of_reads - b_num_of_reads),1) END),
--Write stats--
(a_num_of_writes - b_num_of_writes) as Writes,
[TotalByteWrite] = ((ISNULL(a_num_of_bytes_written,0) - ISNULL(b_num_of_bytes_written,0))),
[AvgBytePerWrite] = ((ISNULL(a_num_of_bytes_written,0) - ISNULL(b_num_of_bytes_written,0))) /
(CASE WHEN ISNULL((a_num_of_writes - b_num_of_writes),1) = 0
THEN 1 ELSE ISNULL((a_num_of_writes - b_num_of_writes),1) END),
a_io_stall_write_ms,
b_io_stall_write_ms,
[WriteLatency(ms)] =
(ISNULL(a_io_stall_write_ms,0) - ISNULL(b_io_stall_write_ms,0)) /
(CASE WHEN ISNULL((a_num_of_writes - b_num_of_writes),1) = 0
THEN 1 ELSE ISNULL((a_num_of_writes - b_num_of_writes),1) END)
FROM CTE1
WHERE rnk > 1


Here are some result. Between the snapshot at 13:00 and 14:00 there has been 184705024 bytes written to datafile nr one in the database im looking at. By compare the a_io_stall_write_ms and b_io_stall_write_ms and divide it by num_of_writes we also can se the average write responsetime during the period. Same goes with reads of course.


Monday, November 24, 2014

How to know if an index is compressed

In management studio you can see if a table is compresed by just chose properties on it. But why is it not the same for index? Something that would be nice as I see it. Anyway, we can use some code to find it out.

SELECT * FROM sys.partitions a
INNER Join sys.indexes b ON b.object_id = a.object_id AND b.index_id = a.index_id
WHERE a.data_compression > 0